PPFD & PAR: Horticultural Lighting Metrics Guide
Expert insights from our Zhongshan LED grow light engineering team
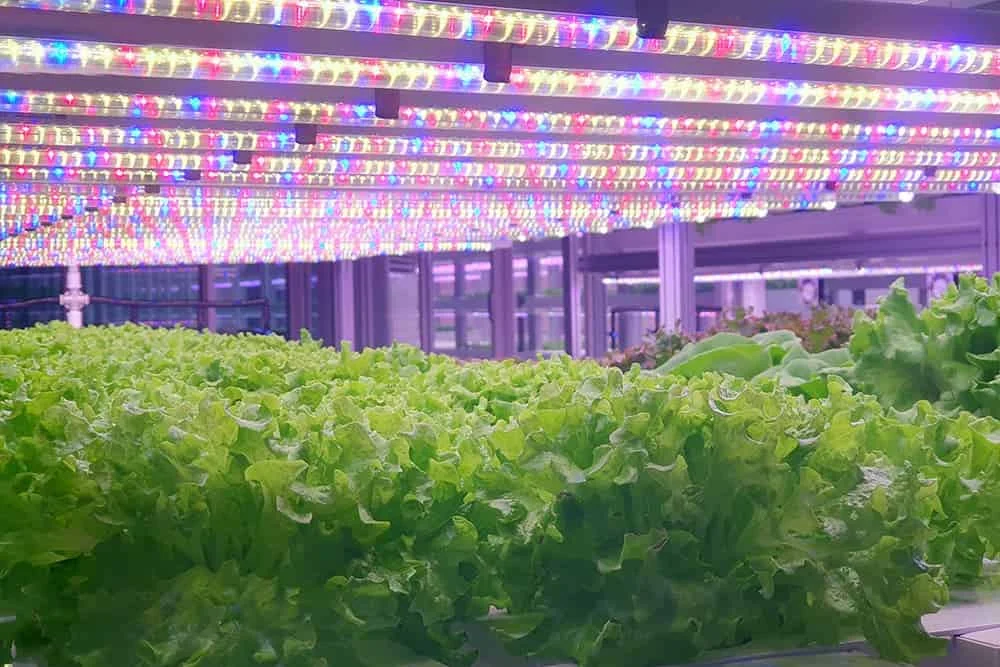
The language of horticultural lighting is filled with acronyms — PAR, PPF, PPFD, PPE, DLI — that can confuse even experienced growers. Understanding what these metrics actually measure is essential for selecting the right LED grow lights and optimizing your cultivation environment.
PAR (Photosynthetically Active Radiation): The Wavelength Range
PAR is not a unit of measurement — it is a definition of the wavelength range that plants can use for photosynthesis: 400 to 700 nanometers. This encompasses blue, green, yellow, orange, and red visible light.
PPF (Photosynthetic Photon Flux): Total Light Output
PPF measures the total number of photons in the PAR range that a light fixture emits per second, expressed in micromoles per second (umol/s). Think of PPF as the total light output — similar to how lumens measure total visible light output for human lighting.
PPFD (Photosynthetic Photon Flux Density): Light at Canopy Level
PPFD measures the number of PAR photons that actually land on a specific surface each second, expressed in umol/m²/s. This is the most important metric for growers because it indicates the usable light intensity at plant level. PPFD varies with distance from the light source — doubling the distance reduces PPFD to one-quarter.
PPE (Photosynthetic Photon Efficacy): Energy Efficiency
PPE measures how efficiently a fixture converts electrical energy into photosynthetic photons, expressed in umol/J. Top-tier LED grow lights achieve 2.8-3.2 umol/J, while HPS lamps manage 1.5-1.8 umol/J. Higher PPE means lower electricity bills for equivalent light output.
DLI (Daily Light Integral): Total Daily Light Dose
DLI measures the total number of photons that reach a surface over a 24-hour period, expressed in moles per square meter per day (mol/m²/d). Different crops have optimal DLI ranges: lettuce 12-17, tomatoes 20-30, medicinal plants 30-45 mol/m²/d. DLI is the target metric that determines how many fixtures you need and how long to run them daily.
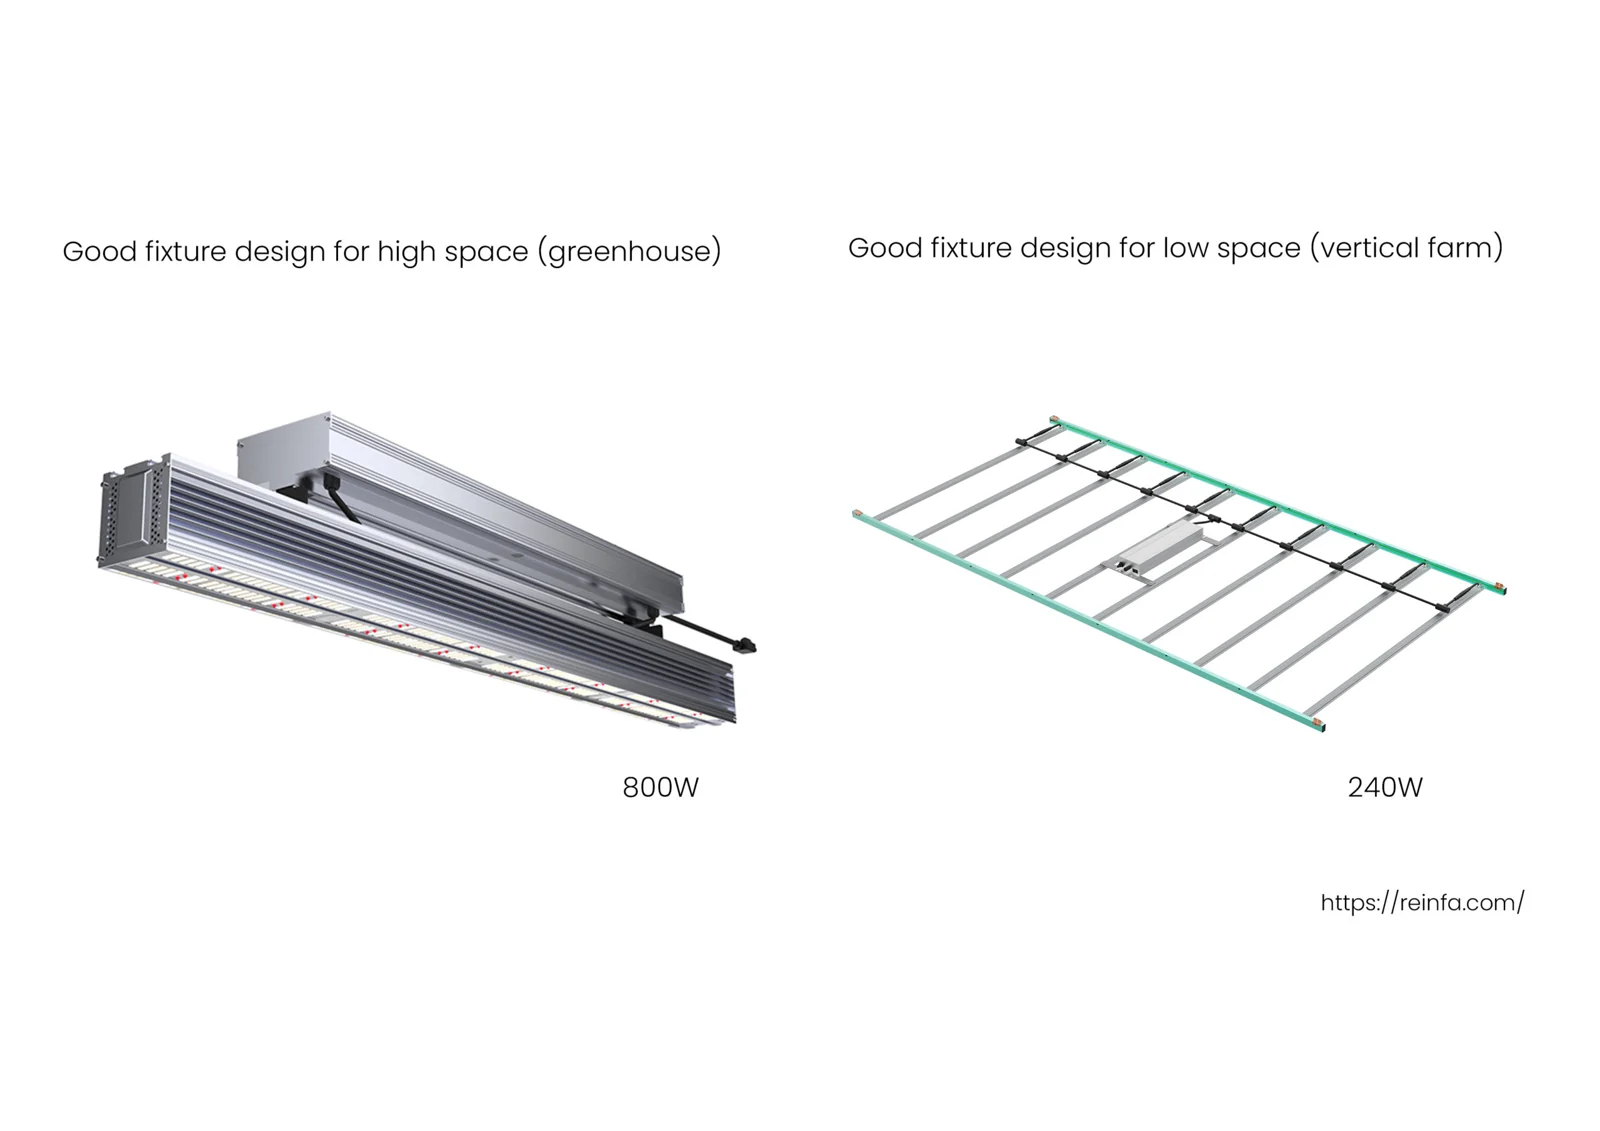
From measurements to a purchasing decision
A PPFD map is most useful when the canopy area, sensor positions, mounting height and dimming setting are stated. Request the average, minimum and maximum over the same grid for each candidate layout. A peak value at the centre does not describe the light distribution across an entire bed.
For a constant PPFD, DLI equals PPFD × operating hours × 0.0036. As an arithmetic example, 300 µmol/m²/s for 16 hours gives 17.28 mol/m²/day. If daylight or dimming varies during the day, add the contributions over their respective time periods. Include the schedule with the lighting brief so the supplier can compare the intended use.